When looking back at the year gone by, it is rather hard to know where to start.
The death of a monarch, war in mainland Europe, the shortest running prime minister of all time. It has been an extraordinary 12 months of news, especially for the economy. Rather than running through the whole thing in narrative form, here are four of the biggest stories – along with the charts that help tell them.
1. The return of inflation
That 2022 was going to be a year with high inflation was hardly a surprise. It was clear from the middle of last year that prices were on the rise, and by the time the Bank of England began raising interest rates in December 2021, it already looked slightly behind the curve.
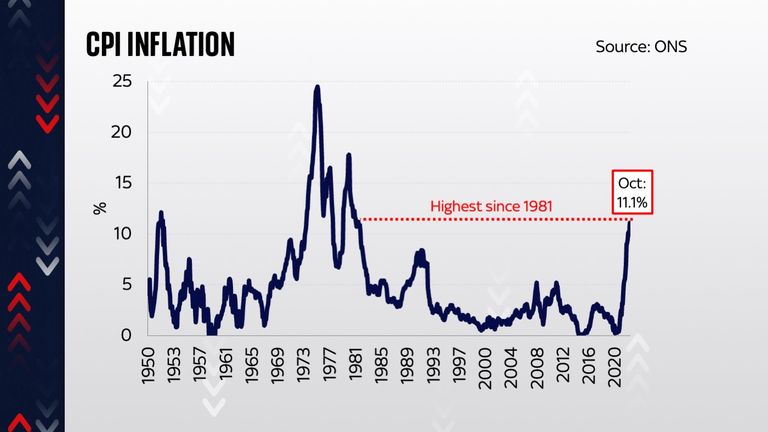
All the same, the leap in prices in 2022 was both dramatic and historic. You can see it for yourself in the chart of the period. By October, the consumer price index (CPI) was telling us that prices were rising at an annual rate of 11.1 per cent – the highest rate since 1981.
The striking thing about high inflation is how quickly it feeds into one’s way of life. There is the big picture: the fact that we’re all worse off, because our earnings aren’t rising at the same rate. There’s the impact it has on businesses, who are seeing their margins compressed and having to wrestle with how much of their cost increases to pass onto customers. And then there are the knock on consequences we’re still living through.
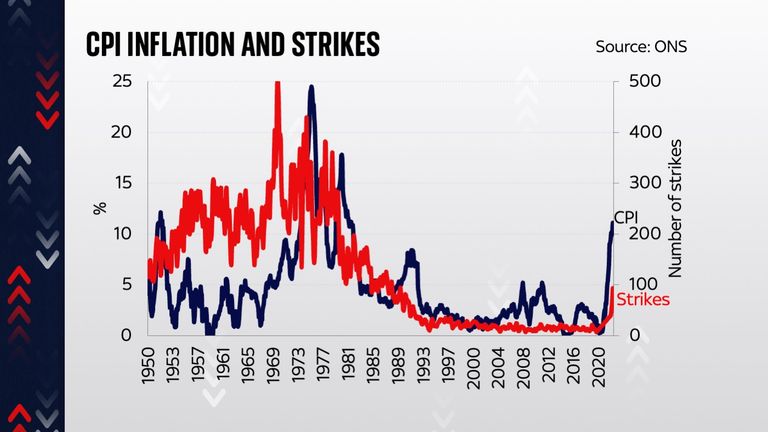
One of those consequences is a sharp increase in industrial action. The funny thing, when you look at the shape of that CPI chart, is how similar those lines are to another data series – the one showing the frequency of industrial action in this country. The UK lost well over a million working days to strikes towards the end of 2022 (the final figure will be considerably higher, when it eventually gets published).
But when you overlay those two data series, you can see that given where CPI rose to and given the relationship between these two lines in the past, the number of strikes seems likely to head far higher.
The good news is that as the year ended, inflation seemed to have peaked. The question is what happens to energy bills and wider household costs in the coming months.
2. Gas prices
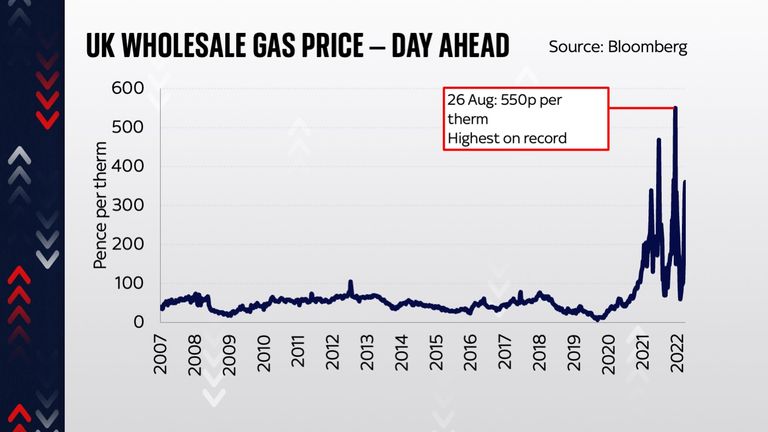
Speaking of energy bills, it’s worth dwelling for a moment on the extraordinary increase in gas prices in 2022. We have simply never seen these prices rise this high – ever.
One thing worth noting is that the increases, from a relatively low and stable level back before 2020, long preceded the war in Ukraine. There is no doubt that the Russian invasion caused a sharp spike in prices, but this was far from the only thing pushing up these prices.
But we have all suffered the consequences. Not just in our energy bills – though that’s the most obvious and painful impact – but everywhere else too. One thing we’ve all had to go back to basics and try to understand this year is the extent to which so many parts of our lives, so many products we all use, are made in part with gas, from the tomatoes you buy in the supermarket to the technology products you have in your pocket. Even a new car relies on gas to dry the paint being applied to it. For the time being, we still live in a fossil fuelled world, so for the time being, charts like this will have an enormous impact on our lives.
3. Real household disposable income
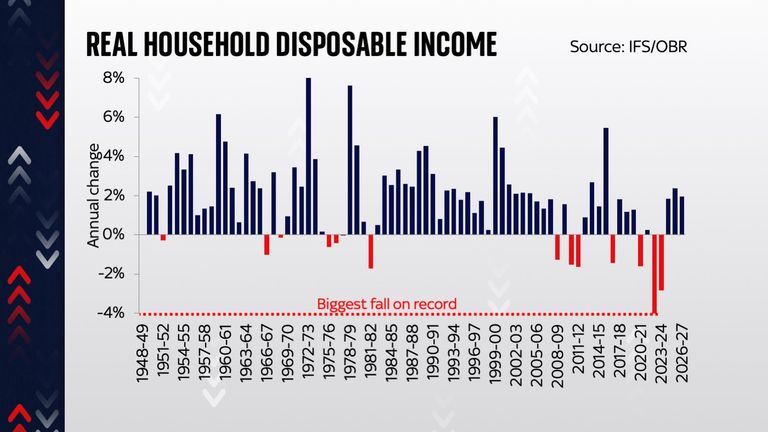
The upshot of those higher prices, however, is a severe hit to our living standards. Perhaps the clearest way to see this is to calculate the disposable income we all have after you’ve subtracted inflation and essential items from our income.
And on this front the news is not good. This chart, originally produced by the Office for Budget Responsibility first in March and then again in November, shows you how that real household disposable income has changed – and is forecast to change. And due in large part to the cost of living crisis, this measure of our living standards is due to shrink this year and next at the fastest rate ever. It’s a chilling calculation, underlining something quite important.
While we have lived through more recessions in recent years than anyone cares to remember, this particular recession may prove more painful, and is likely to be felt more intimately in our pockets, than any of those preceding slumps. Such things matter.
4. The pound hits a record low
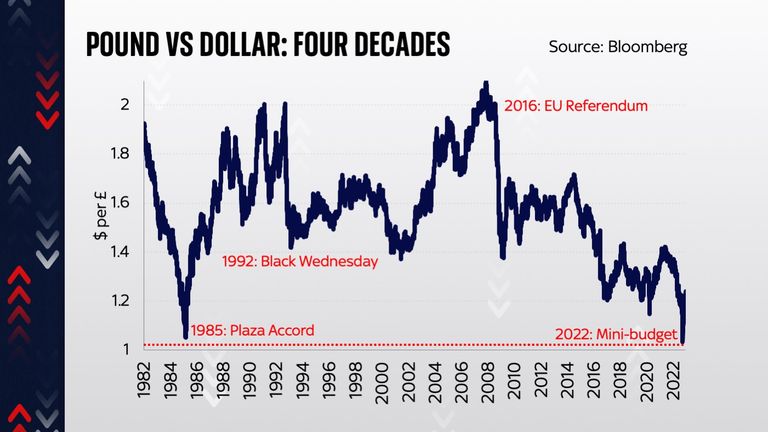
Finally, it would be remiss to offer an account of the year without referring to the drama of September and October, when Liz Truss and Kwasi Kwarteng presided over a fiscal statement that precipitated an astounding collapse in the value of the pound.
In the days after the statement, sterling dropped sharply in value, eventually hitting a low of just above $1.03 vs the US dollar. This was the lowest level on record, lower even than the levels in 1985 which marked the previous nadir. In that case, the story was primarily about the dollar’s strength – a phenomenon which so worried the US authorities that they staged a summit, the Plaza Accord, in an effort to bring it down against other leading currencies.
This time around, the story was slightly different. The dollar was undoubtedly strong in the preceding weeks, with economists expecting big increases in the main US interest rate, but the real story was about UK weakness. With consternation among UK investors about the course of policy under Truss and Kwarteng, the pound dropped not just against the dollar but against other currencies too. And after Truss was replaced with Rishi Sunak, it began to bounce back.
These are just small data-driven windows into an extraordinary year. But they raise a question: when we come to look at the defining charts of 2023, will they be quite as dramatic as these ones?
